Data visualisation using interactive graphs
Raw data is cold and shapeless. CHP Design work extensively with Hedge Funds and Asset Managers to present visual representations of data for investors. Interactive graphs provide immediate insight into trends with high and low values over time.
Interactive Graphs
From Net Asset Value (NAV) for investors to New Car Registrations for the UK automotive sector
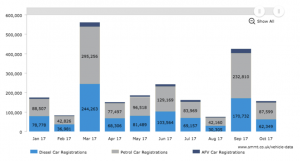
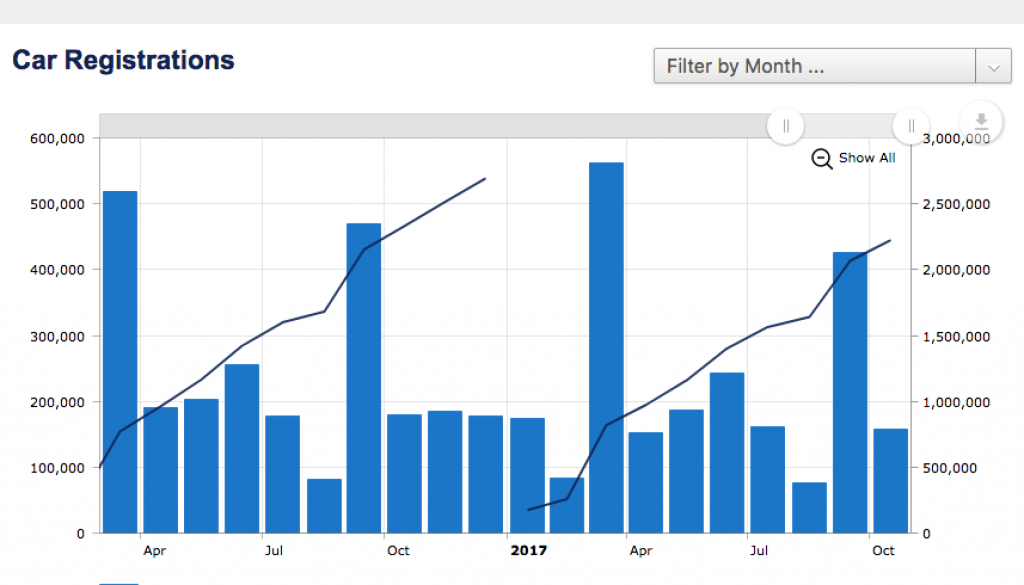
Building on experience with graphs for investor information, CHP provide SMMT (Society of Motor Manufacturers and Traders) a web application to visualise monthly figures for:
- Total new car registrations; then
- new car registrations by fuel type (Petrol, Diesel, AFV and MHEV); and
- new car registrations by sales type (Private, Fleet, Business);
- Total new LCV (Light Commercial Vehicles) registrations; then
- New LCV registrations by fuel type (Diesel, AFV, Other);
- Total cars manufactured; then
- Number of cars manufactured for home/export markets;
- Total commercial vehicles manufactured; then
- Number of commercial vehicles manufactured for home/export markets;
 Graphs can provide various interactive options to easily change between data sets, date range and/or toggle graphs shown without refreshing the page. Visually, they work within the existing corporate branding and technically, they function within existing website.
Data functions are designed for real-time display hence data can be updated as regularly as required. The update process is simple and quick with preview/publish/rollback options for maximum flexibility. CHP created a structure for the data to facilitate the addition of new graphs in the future.
There is a facility to easily export the current graph selection as a picture for publications.
NAV and price information for funds
We cannot publish details regarding user specific functions for asset/fund management. Please contact us for more information about how these functions can be applied to fund data.
